|
The
flexibility of
money, as with so many of its qualities, is most clearly and
emphatically expressed in the stock exchange, in which the money
economy is crystallized as an independent structure just as political
organisation is crystallized in the state. The fluctuations on exchange
prices frequently indicate subjective-psychological motivations, which,
in their crudeness and independent movements, are totally out of
proportion in relation to objective factors.
Georg Simmel. The Philosophy of Money.
1900/1979.
|
Introduction
Why use
sonification?
The ASX
All-Ordinaries Index (XAO)
Net Returns
Sonification of Net
Returns
Uniform Random
(white–noise)Returns
Gaussian (bell-shaped) Returns
Decorrelation of Returns
Summary Snapshots
Introduction
There are many reasons, both
sociological and
technical, why capital
markets are an interesting application–domain for sonification.
Sociologically, they have become a
powerful, some might say almost religious, contemporary force, even as
their overtly emotional expressive open-outcry marketplaces have
become, or are quickly becoming, virtualised gatherings of disembodied
screen traders. Sonification of the activities of these markets thus
functions as a form of re-embodiment.
While such sociological
considerations are interesting, the studies reported here are more
pragmatic and
descriptive. Despite intensive study, a comprehensive
understanding of the
structure of capital markets exchange trading data remains elusive. For
an overview of this issue, see Chapter 5 of Sonification
and
Information, including more
detail of the techniques illustrated here, or just read a brief overview of market data.
Why use sonification?
The power of visual representation to enhance and deepen the
understanding of phenomena and their abstractions is undisputed. Yet,
as with many time-domain processes, visual representation does not
always reveal the structure of the data. In The (mis)Behavour of the Markets
Benoit Mandelbrot emphasises the difficulty, even impossibility, of
distinguishing the difference between real market data and
computer-generated Brownian motion using graphs.
This leads to a sonification question: Are there ways of
presenting trading data that enable its structural characteristics to
be perceived aurally?
To explore that question, we sonify the XAO, an
Australian
market index, along with a computer-generated statistical analogue
of it for comparison.
The ASX All-Ordinaries Index (XAO)
The dataset chosen is twenty-two years (21April 1986 to 18 April 2008)
of the daily closing price of All Ordinaries Index (ticker XAO) of the
Australian Securities Exchange (ASX). The XAO is the broad Australian
market indicator, a composite of the 500 largest companies,
weighted by
capitalisation, which are listed on the exchange. Figure 1 is a
graphical representation of this datset.
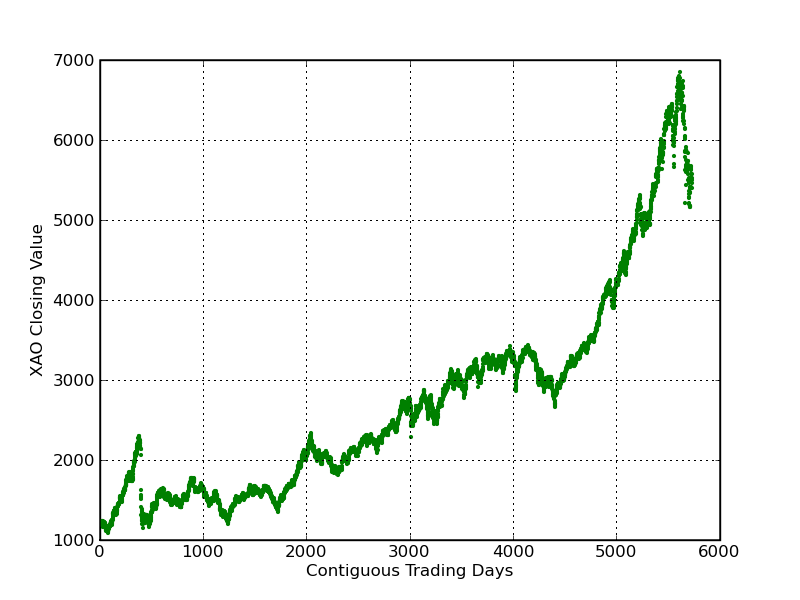 Figure 1. 22
years of daily closing prices
of the ASX-XAO. Figure 1. 22
years of daily closing prices
of the ASX-XAO.
Net Returns
As
the value of XAO increase roughly exponentially over time, the
technique chosen here is to convert the dataset in to a series of
net-returns, or ratios of successive value differences. For an asset
whose price changed from p(t) at time t to p(t+dt) at time t+dt, the
linear net returns Rnet are defined as (p(t+dt) - p(t))/p(t). Figure 2
is a graphical representation of these net returns. The insert is an
amplification of the dotted sesction containing a very negative
return–that of 20 October 1987 (“Black Tuesday"), the largest one-day
percentage decline in stock market history.
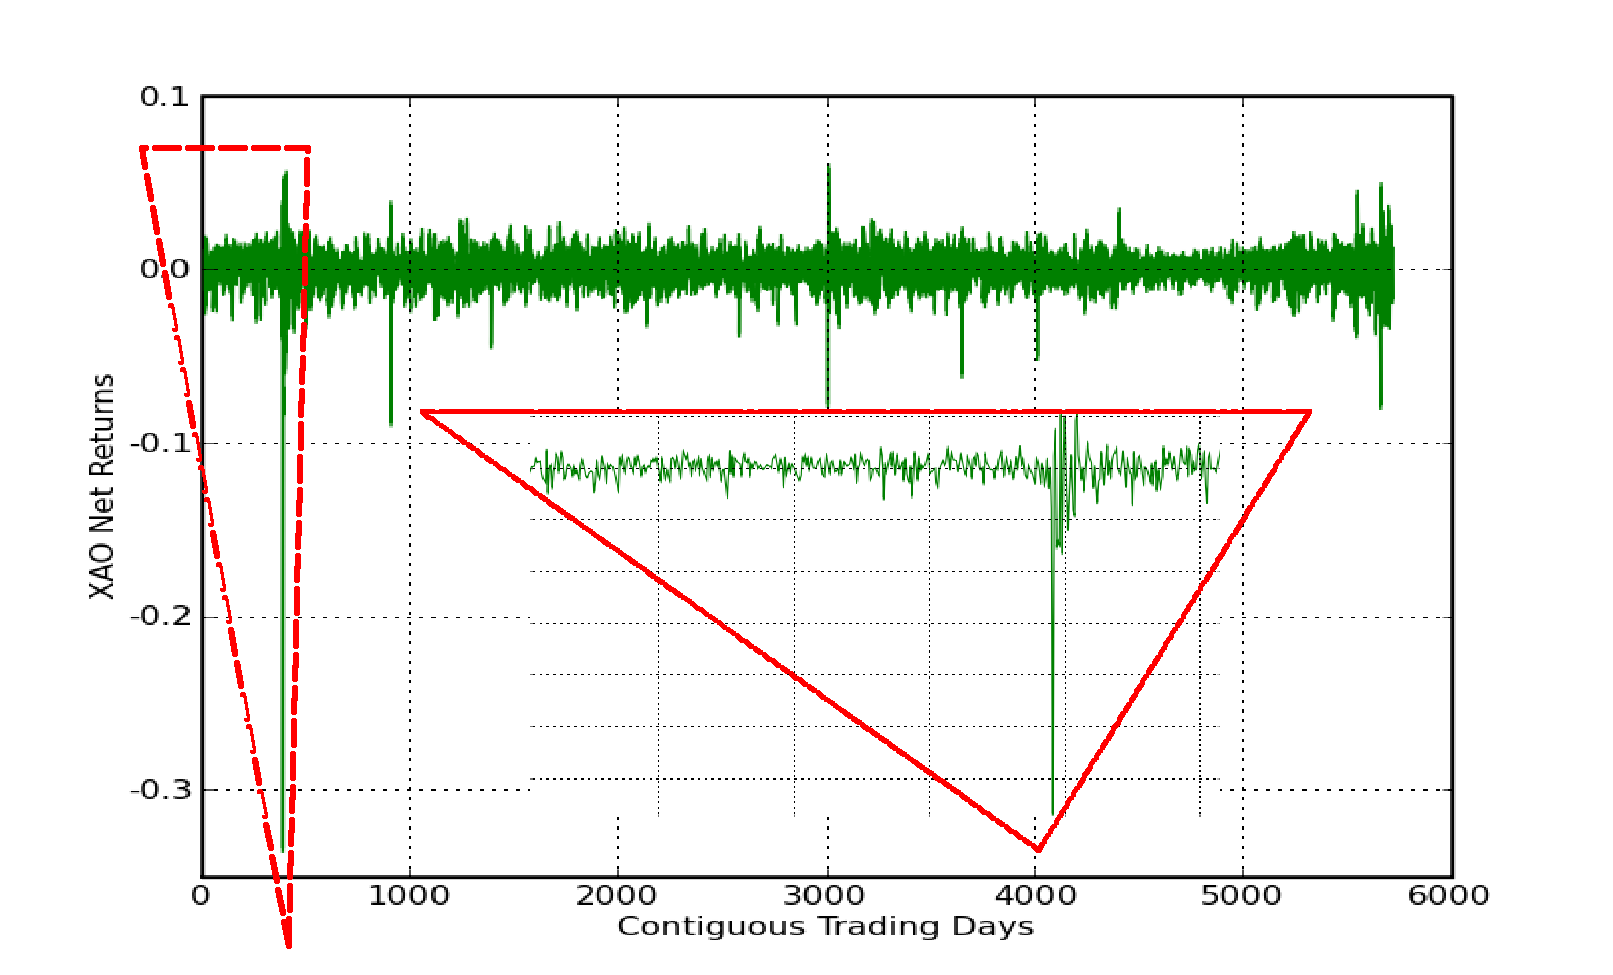
Figure 2. Graph of the Net Returns of the
XAO dataset.
Sonification of Net Returns
Clearly,
there are a number of possible mappings of his dataset into sound.
Because it basically oscillates around zero, it is possible to audify
it directly. However, for this discussion we map it using a very simple
technique we call homomorphic
mapping sonification in which the zero is assigned a centre frequency
and the positive and negative returns are used to modulate that
frequency within a fixed range. (For an exposition of using direct
audification, see Chapter 5 of Sonification
and
Information.)
In the following
audio example, the
modulation rate is 8 Hz (i.e. 8 tones per second), the centre frequency
is 300Hz and the frequency range is three octaves. The "Black Tuesday"
return has been reduced to the next lowest level (near the left-hand
corner of the insert triange) in order to more effctively use the pitch
range.
play XAO net returns
sonification (7.6 Mb MP3 file)
Larger changes in pitch indicate larger changes, i.e. higher volatility, in $value.
NB: If you don't want to download the whole file and that of the other
3 examples, you can download a single file of 20
second snippets of all 4 examples (1.4Mb MP3 file - see the Summary at the bottom of this
page). This is the third
snippet.
How can the sonification of net-returns
be characterised? One way is to compare it those of other known
datasets. This leads to a second sonification question:
Can
real trading data
be distinguished
from a stochastic simulation of it?
Notice the overwhelming
preponderance of small pitch changes (small changes in net returns)
with occasional periods of greater volatility. This is even clearer
when we compare it to a couple of standard distributions: uniform random, and Gaussian.
Uniform Random (white–noise) Returns
In a uniform
random, or "white noise" distribution, all net returns all are equally
likely. Here is a sonification of uniformly random net returns to
compare with the market net returns:
Gaussian/Normal (Bell-Shaped) Returns
In a Gaussian,
"normal" or bell-shaped random distribution, the net returns with the
greatest frequency are centred round the mean and those furthest away
from the mean occur less often. In this manner, normally-distributed
returns are more statistically similar to market returns than uniformly
random returns. In fact classical quantitative theory (after Bachelier)
proposes that they are identical. Here is a
sonification of a set of normally distributed random returns, with the
same mean and standard deviation as the original set of market returns.
Decorrelation of Returns
Figure
3 is an overlay of histograms of a normal distribution with that of the
returns dataset. It clearly illustrates that the returns
are not normally distributed: more returns are bunched around the mean
and in the tails of the market net returns distribution than in a
normal distribution.
As a final comparison, a sonification of a statistically identical but
decorrelated dataset to the net returns is presented. While they both
appear to have short trending auto-correlative sequences, those
of the net returns appear more consistently and when they do they
appear to last for longer periods of time.
play
decorrelated net returns
sonification (7.6 Mb MP3 file)
|
Figure 3. A overlay
of a histogram of the clipped net returns (green), with a histogram of
a simulated normal
distribution with the same mean, standard deviation and number of datum
(black).
|
Summary Snapshots
As a summary, here is 4 snippets of
sonifications of the four datasets presented in this overview.
A. Uniformly distributed random data.
B. Normally distributed random data.
C. XAO Net Returns data.
D. Decorrelated XAO Net Returns data.
|
 market
sonifications
market
sonifications